We have just completed our annual review of our neutral
strategic asset allocations and, basically, the executive summary is that we
have increased our core fund’s neutral global equity exposure from 30% long and
10% long / short upwards to 35% and 10% respectively thus giving a total of
forty five percent. This is at the expense of Government Bond exposure, which we
have now reduced from 15% to 10% on a long term neutral basis. Whilst the move
may appear small it will have a material impact on the tactical asset allocation
moves and risk management within the overall portfolio on a daily and monthly
basis.
This comes from an annual review based on our expected ten
year forecast returns optimized within the portfolio. It is important to know
that it does not change very often. The neutral long global equity exposure was
effectively reduced in 1999/2000 from 50% to 30% and has remained there until
now. We have always believed that strategic asset allocation is not static asset
allocation based on averages, but is driven by asset class valuation. We see
risk in terms of making absolute not relative returns. An efficient frontier
portfolio based only on historical standard deviations alone would have produced
the same static allocation for global equities for the 1990s and 2000’s.
However, in one decade the S&P produced 400% returns and the
other 0%. No further explanation is needed.
For those who have not read GMO’s James Montier’s white paper
entitled “I want to break free or Strategic Asset allocation # Static Asset
Allocation” please contact me for a copy as it explains this whole subject much
more clearly than I ever could.
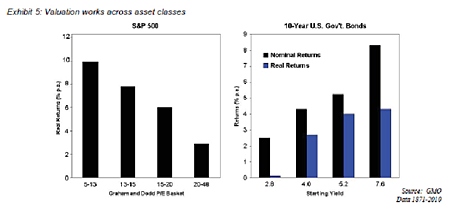
Valuation of asset classes matters greatly. The chart below
from GMO’s report illustrates the point very clearly. For global equities (using
S&P500 as proxy) if your allocation when PE valuations are 20-48 times ten year
average earnings you can expect 2% per annum real returns as against 10% per
annum real returns if you buy on PE multiples of 5-13 times etc.
For Government Bonds, if you buy at a starting yield of 2.8%
on 10 year US T Bond you get 0% real return on a 10 year view versus buying at
7.6% yield equals 4% real returns for the next 10 years. Go figure.
Whilst global earnings still reflect the highest profit
margins in multiple decades, and the European Debt crisis is far from solved, we
believe the ten year expected real returns are very close to the left hand axis
in each chart above and a Strategic Asset Allocation shift is required.
In conclusion, global equities are much better value than
they were ten years ago, government bonds offer terrible value with zero real
return, if not negative on a 10 year view and gold has nearly achieved its
valuation target but is probably not quite there.
For our cautious to balanced portfolio to have had the same benchmark asset
allocation to any of these asset classes over the past twenty years is
ludicrous, but that is what most efficient frontiers produce. The standard
deviation remains the same but the returns vary wildly. As stated before, no
further explanation is required. Basically, when it comes to funds there are
lies, damned lies and statistics. Rather than drown yourself in figures that are
produced by the people who want you to buy their fund, look at independent
research and select the funds you feel comfortable with and match your own
investment requirements - especially when it comes to risk/reward ratio.
|
The above data and research was compiled from sources
believed to be reliable. However, neither MBMG International Ltd nor its
officers can accept any liability for any errors or omissions in the
above article nor bear any responsibility for any losses achieved as a
result of any actions taken or not taken as a consequence of reading the
above article. For more information please contact Graham Macdonald on
[email protected] |

