In the world of finance, you hear a lot of sayings and superstitions. I even heard someone say “buy Apple shares” once. But there’s one old adage that might actually have some substance.
The saying I’m talking about is Sell in May and go away, buy again on St Leger Day. The day in question is the St Leger Stakes, the final horse race of the English Triple Crown. It takes place in September and is the traditional end of the season. The saying refers not necessarily to the specific date of the race, but generally staying out of the market during the less-profitable summer months and investing fully in the winter.
Of course, it’s not always true – it’s quite possible that returns can be made in the summer months. If we average the S&P’s monthly performance since 1950, we can see there is a definite trend in favour of walking away from the market in May (see chart 1).
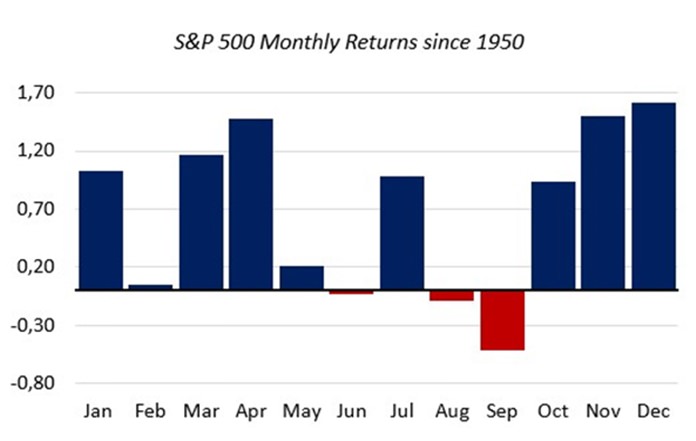
There’re also some plausible causative factors. For example, in the UK there is often a lull because of the new tax year; whereby activity increases towards the end of the previous fiscal year, pulling forward buying whilst delaying selling. Of course it also has a lot to do with thin volumes because of the summer holidays.
But this year we should also focus on equity valuations too as they’re the key defining point behind where we’re at. A recent white paper by HSBC asked, “Are equities overvalued?”1 It begins by referencing the father of value investing, Ben Graham, who famously likened the stock market to a voting machine in the short run and to a weighing machine in the longer run. In other words, over a short period of time equity prices may move away from fundamentals, but over a longer period there’s not such a large gap. Current valuations are in no small measure a reflection of unprecedented policy, the “sugar high” that, when it wears off, will give rise to market weakness and volatility.
In the white paper, HSBC disparage as bearish the view, “The idea that there should be mean-reversion back to long-run averages is typically made with reference to equity valuation metrics.” To illustrate this the paper took a selection of popular price ratios against their historic average readings: below are the 3 that have the greatest very long term substance (see table).
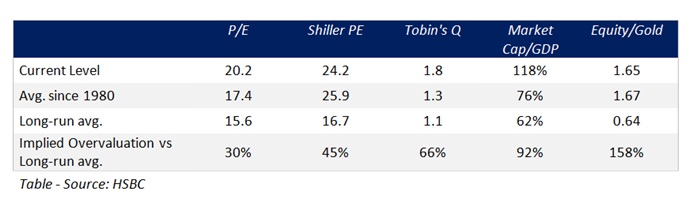
HSBC admit, “Many of these metrics remain well above historic averages. Using a long, 100-year time series to benchmark these readings adds further plausibility to this argument.”2 I’d prefer to note that the 3 key metrics show an overvaluation of 89% which becomes 90% if Warren Buffet’s favourite valuation metric, Market Capitalisation to GDP, is added to the mix. I’d excuse normal P/E ratio as less relevant because the data quoted by HSBC only date back 1971; a very misleading data subset.
HSBC explain that the “Shiller PE, for example, is a widely-followed metric, which compares the current equity price to smoothed (10-year) earnings. Academic studies have evidenced a strong link between high Shiller PEs and weak future long-run equity returns.3 Today, it’s reading over 24, a situation which Professor Shiller argues has occurred only infrequently (in 1929, 2000, and 2007) and has each time been followed by a market collapse.
As Shiller wrote in the New York Times last year:4
It is entirely plausible that the shaking of investor complacency will …. take the market down significantly and within a year or two restore CAPE ratios to historical averages. This would put the S&P closer to 1,300… and the Dow at 11,000. They could also fall further; the historical average is not a floor.
After the recent market rout and rapid rebound, the S&P is trading at around 2,050 and the Dow at around 17,500. If Professor Shiller is right, there is significant further downside to come and investors need to be extremely wary of the outlook for equities.
The market capitalization-to-GDP ratio is also significantly ahead of historic norms. HSBC also explain Tobin’s Q – a measure widely followed by macroeconomists, which charts firms’ asset value against current market value. Current levels are also showing an extreme reading relative to their 100-year average.5
Their summary of the data is, “The point is, as Professor Shiller eloquently puts it, that equity price ratio analysis leads many economists to conclude there are predictable further losses ahead. The assumption is that what goes up (“unsustainably”) must, eventually, come down.”6
In similar vein Coram’s James Sullivan recently noted that the last time that UK leading economic activity indicators were at current levels the FTSE was below 4,000!
However, HSBC does not believe the issue is quite so straightforward. They argue that ZIRP or NIRP changes the inputs that have to be used for equity valuations which the white paper lays out – HSBC then construct their own case by the classic Gordon growth model.7
Relying on an equity valuation model that could well be inappropriate, they also make an assumption that “government bond yields have not behaved like classic sine waves historically. Rather than mean-revert neatly, bond yields have historically alternated between phases of stability coupled with temporary mean-reversion and significant “jumps”. These jumps coincide with shifts in the economic regime.”8
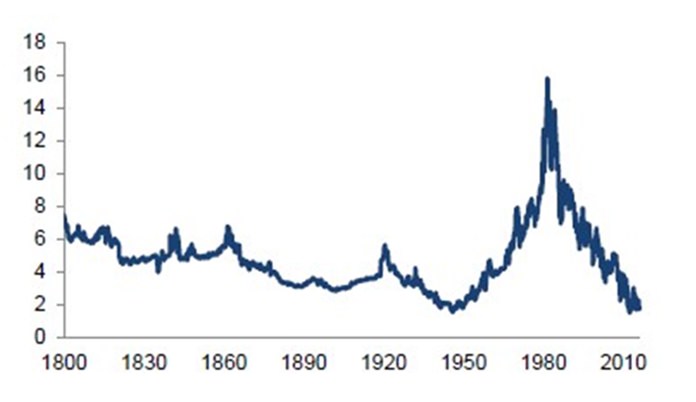
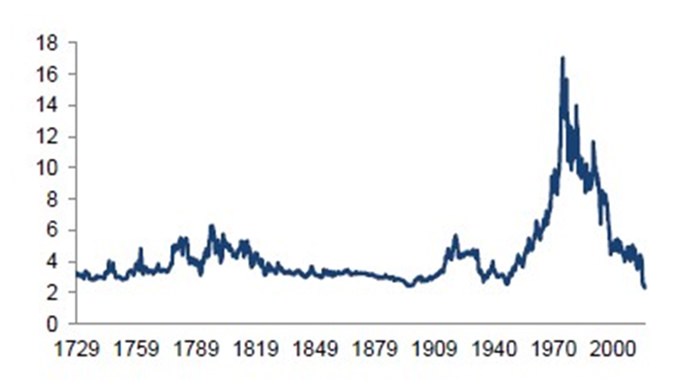
That’s all very well, but it ignores the clear long cyclicality of interest rates underlying shifts in equity valuation parameters. Adjusted for these factors bond yields are, in my view actually quite consistent, other than the scales of rate blow-outs in the 1970s and 1980s, which are explained by executing markets at the time (see charts).9
Historical US Government Bond Yield
One key question that will impact equity prices is whether bond yields have pulled forward the low point or could it still be as much as 10-15 years ahead of us. I believe that this is the key question to answer, although I concur with HSBC that bond yields are “very low relative to the last 30 years, meaning the phase of bumper asset returns we enjoyed since the 1980s is over and, mathematically, cannot occur again from current levels.”10
Historical UK Consol Bond Yield
Therefore, the importance of bond yields is that, despite HSBC’s views, ZIRP and NIRP are key factors in equity valuations and this support will ultimately be removed. Accepting this, trying to justify valuations at today’s levels seems like a futile process if we agree that:
- Equity valuations are vulnerable to normalization of interest rates that could start to occur at any time in the next decade or two.
- Until then equity returns are likely to be disappointing anyway.
Consequently, I think that the key valuation issues are that equities are expensive today because at some point, which may or may not be imminent, a major equity correction is inevitable and until then equity returns will be disappointing – like pennies in front of a giant bulldozer? To me, that implies equities today are overvalued.
HSBC on the other hand seem more interested in the intellectual exercise of justifying today’s valuations is today’s context and therefore disproving that a significant correction is imminent. This is interesting but, for me, less useful.
In Part 2, I explain why.
Footnotes:
1 http://www.assetmanagement.hsbc.com/uk/attachments/institutions/are_equities_overvalued.pdf
2 idem
3 e.g. Campbell and Shiller (1997), Valuation Ratios and the Long-Run Stock Market Outlook, Journal of Portfolio Management, http://www4.fe.uc.pt/jasa/m_i_2010_2011/valuationratiosandthelongrunstockmarketoutlook.pdf
4 http://www.nytimes.com/2015/08/30/upshot/rising-anxiety-that-stocks-are-overpriced.html?_r=0
5 http://www.assetmanagement.hsbc.com/uk/attachments/institutions/are_equities_overvalued.pdf
6 idem
7 Gordon (1959), Dividends, Earnings and Stock Prices, Review of Economic Studies
8 Bansal et al (2003), Regime-Shifts, Risk Premiums in the Term Structure, and the Business Cycle, Duke University Working Papers
10 http://www.assetmanagement.hsbc.com/uk/attachments/institutions/are_equities_overvalued.pdf
| Please Note: While every effort has been made to ensure that the information contained herein is correct, MBMG Group cannot be held responsible for any errors that may occur. The views of the contributors may not necessarily reflect the house view of MBMG Group. Views and opinions expressed herein may change with market conditions and should not be used in isolation. MBMG Group is an advisory firm that assists expatriates and locals within the South East Asia Region with services ranging from Investment Advisory, Personal Advisory, Tax Advisory, Corporate Advisory, Insurance Services, Accounting & Auditing Services, Legal Services, Estate Planning and Property Solutions. For more information: Tel: +66 2665 2536; e-mail: [email protected]; Linkedin: MBMG Group; Twitter: @MBMG_GROUP; Facebook: /MBMGGroup |


