A successful asset allocation strategy goes further than just allocating assets to broad asset classes. Allocation within these classes is also vitally important. Unfortunately this is not as simple as following a quantitative model. It is of great importance to have a fundamental understanding of the current situation to start with in order to structure each component of the broader allocation correctly.
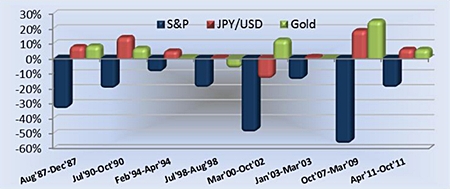
To illustrate this, we look at a common perception within currencies and commodities that some investors hold without assessing the fundamental backdrop, namely the “flight to safety” premise, where they believe Gold and the US Dollar gain in ‘risk off’ periods. The chart shows the Japanese Yen relative to US D over eight bear markets since the mid 1980’s. The Japanese Yen provides positive returns in these periods, which shows that it offered better protection than the USD. However, the Yen is not a perfect hedge, as when the IT bubble burst, it did not offer much, if any, protection at all. Gold also only offered positive returns in 10 out of the 13 US bear markets since 1970.
The asset class where most investors attempt to get exposure to high Beta during periods of ‘risk on’ and low Beta during periods of ‘risk off’ is equity. Within this asset class there is the perception that some sectors clearly do the trick better than others. As above, this holds true to an extent on average, but the results of this strategy can be vastly improved with a deeper understanding of whatever the current market is at the time.
The bar charts here depict the average return (middle bar) of each sector during all ‘risk off’ (bear) and ‘risk on’ (bull) markets over the past 20 years as a ratio to the general market as a proxy for its Beta. To give a sense of the reliability of this relationship we plot plus (back bar) and minus (front bar) one standard deviation from the average. The smaller the range, the more reliable the average will be as a guide to action.
Reading from left to right the columns are: Technology, Financials, Energy, Healthcare, Staples, Consumer Discretionary, Industrials, Utilities, Materials, Telecoms.
 Risk On Risk Off
Whilst some average results are hardly surprising (such as staples, healthcare and energy offering downside protection), dispersion on many is quite wide. Tech stocks would have been a leveraged play on the downside at some stages, whilst being negatively correlated when markets rallied at other times. Also the consumer discretionary sector underperformed on the down and the up side at different periods. Industrials and materials are not biased one way or the other on average and financials does offer a leveraged play in general as anticipated, but this does not always work and disparities are large.
In a nutshell, this analysis suggests that quantitative analysis is not effective if not backed by fundamental reasoning, which can be different every time the wheel comes around. Therefore, whilst diversification is very important, it is how it is allocated that will bring you in the extra comfort and reward.
| The above data and research was compiled from sources believed to be reliable. However, neither MBMG International Ltd nor its officers can accept any liability for any errors or omissions in the above article nor bear any responsibility for any losses achieved as a result of any actions taken or not taken as a consequence of reading the above article. For more information please contact Graham Macdonald on [email protected] |


