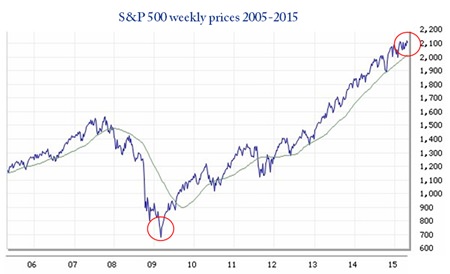
March signalled the sixth anniversary of bulls dominating the S&P 500 – and the run may have some more fuel in it yet, but for how long?
Six years of bullish behaviour is quite a feat – in fact it’s only the fourth time this milestone has been reached since the end of World War II.1 One senior strategist – Brian Belski at IMO – even believes the trend could reach the 15-20 year mark.
Stock prices and QE
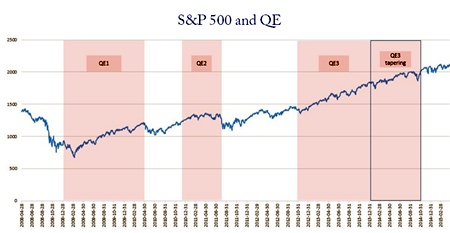
A large reason for such high prices post-Global Financial Crisis (GFC) has to be the Federal Reserve’s quantitative easing programme.
It’s no coincidence that the policy of the Fed spending USD 4.5 trillion on long-term bonds has boosted US stock markets. After all, that was one of its objectives as Alan Greenspan (Fed chairman 1987-2006) admitted back in 2010.2
In fact, between January 2009 and October 2013, more than 100% of equity market gains took place during the weeks the Fed was on its massive bond-buying drive.3
Some analysts believe that QE isn’t the only reason, however. In fact, one senior strategist at Charles Schwab suggests that the policy wasn’t even the most domineering factor. She suggests that earnings growth and stock buybacks are the main reason why the market has continued to rise.4
A look at the S&P price-to-earnings per share ratios shows that, for almost five years now, they have been back to pre-crisis levels. Similarly, earnings in constant dollars are actually higher than their previous peak in 2006.
I would venture to say that the markets are in fact being pushed higher by multiple expansion; as well as in conjunction with earnings per share, which are being flattered by share buy-backs.
| How share buy-backs can influence P/E Ratios Hypothetical example: If a company’s net profits are, say $100, and there are 100 shares, then earnings per share = $1. If profit falls to $99 but the company buys back 10% of its shares then earnings per share has increased by 10% to $1.10. |
In the end, there is no getting away from the fact that the major peaks in S&P prices have come in periods of QE. When dips have occurred, they have generally been shortly after rumours, or actual slowing or stopping, of easing. That’s why I think that it’s too great an assumption to say that QE has not been the dominant force in driving the bullish market.
Continued rise, continued stimulus
Writing this, it is six months since the Fed officially ended its QE programme. The S&P has continued to rise; albeit at a slightly lower rate than during the third phase of easing.
So does this mean that my argument is flawed, and that the bond-buying programme has in fact created a sustained increase in prices, pushing the bullish market towards a seventh year?
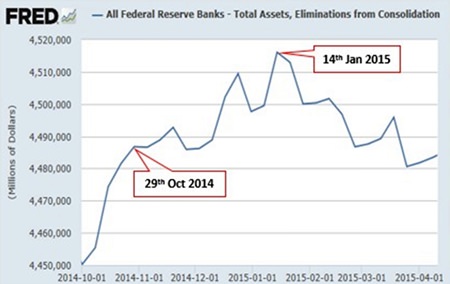
Not really. To start with QE didn’t actually stop until mid-January this year. The Fed’s total assets held stood at USD 4.493 trillion on 29th October 2014, the day the ending of QE was announced. Yet this figure actually peaked on 14th January 2015 at USD 4.516 trillion, some USD 23 billion more.5
In an attempt to ensure markets in the US and around the world didn’t drop as soon as the end of QE was announced, Fed Chairwoman Janet Yellen announced that the benchmark interest rate would remain close to zero for a “considerable time”.6 Not only that, she hinted that the Fed may hold onto the bonds they bought so hastily for years.7
Thus, although the Fed has decided that USD 4.5 trillion is quite enough spending on bonds for now, it is still artificially stimulating stock markets in a quest to grow the economy.
This shows that the bullish market is greatly reliant on Fed stimulus; raising the question “what happens when the string is cut?” If the political wind changes to one of a more laissez-faire approach by the Fed, will the markets fall?
Bernanke’s beliefs
That all depends on whether QE has genuinely improved the US economy enough as a whole, so that it no longer needs artificial support to bring about rising stock prices. This is something which Yellen’s predecessor Ben Bernanke maintains is true.8 Then again, he also maintains that propping up the economy in such a way will not cause an asset bubble.
Given the facts, I beg to differ. Between Q2 2012 and Q4 2014 (the latest figures to be published) the overall US all-transaction house price index rose by over 13%.9 This figure is put into even greater perspective when we consider that inflation averaged at only around 1.5% in 2013 & 2014.10
Not only that: at the launch of QE 3, then Fed chairman Bernanke also stated, “Higher stock and home prices will provide further impetus to spending by businesses and households.”11 It’s difficult to ignore the irony in the fact that Mr. Bernanke has just joined PIMCO – the largest bond fund investor in the world – considering that his policy has been responsible for record bond yield lows around the world.12
So it seems the Fed actually believes that pushing up prices will help the economy move, will get people jobs and won’t create a bubble. Where the direct connection between stocks, houses and money in our pockets lies, I’m not really sure. Also, given past bubbles – the latest of which occurring only seven years ago – these presumptions strike me as hugely optimistic.
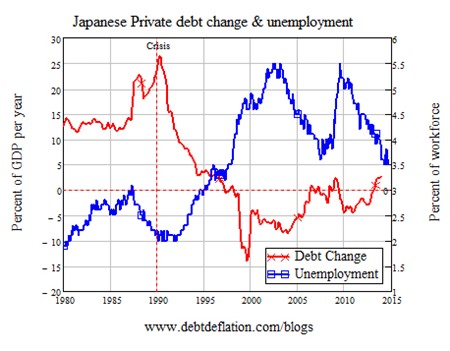
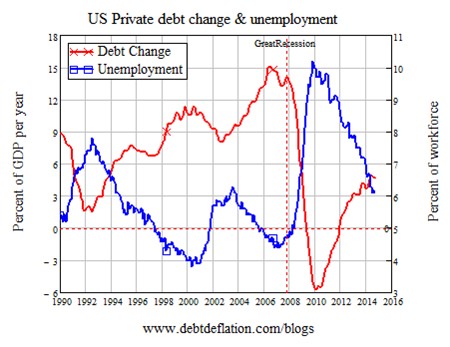
Even if bubbles are not created, the Japanese example of the past 25 years has shown us that once artificial support is lifted, the economy slumps back into recession.13 A look at private debt change and unemployment figures – more realistic measures of an economy than stock prices – shows that the US is on a similar course to that already charted by Japan.
A seven-year itch?
Having said all that, forecasting whether stock prices will drop is a lot easier than predicting when that will happen. Thus it may well be the case that the bulls dominate for a seventh year.
What is more important though, is where that will lead the markets in the longer run, and how much notice the Fed will give before it eventually cuts the string to see if the stock balloon will sail into the air or drop to the ground.
Footnotes:
1 http://www.marketwatch.com/story/why-the-bull-market-
is-ready-to-celebrate-its-7th-birthday-2015-03-06
2 http://www.zerohedge.com/article/alan-greenspan-financial-system-broke
3 http://www.forbes.com/sites/robertlenzner/2013/10/17/
dont-fight-the-fed-because-100-of-stock-market-gains-since-
2009-occurred-in-the-weeks-the-fed-was-buying-bonds/
4 http://www.marketwatch.com/story/why-the-bull-market-is-
ready-to-celebrate-its-7th-birthday-2015-03-06
5 St Louis Federal Reserve, All Federal Reserve Banks – Total
Assets, Eliminations from Consolidation
6 http://www.bloombergview.com/quicktake/federal-reserve-
quantitative-easing-tape
7 idem
8 http://www.bloomberg.com/news/articles/2014-01-16/bernanke-
says-qe-effective-while-posing-no-immediate-bubble-risk
9 Statistics from St Louis Federal Reserve
10 St Louis Federal Reserve, consumer prices for the US,
not seasonally adjusted.
11 http://www.bloomberg.com/news/articles/2012-10-02/
bernanke-seeks-gains-for-stocks-in-push-for-jobs-economy
12 http://www.ft.com/intl/cms/s/0/81de1126-ed8f-
11e4-987e-00144feab7de.html
13 http://www.ideaeconomics.org/blog/2015/1/13/
steve-keens-2015-outlook
| Please Note: While every effort has been made to ensure that the information contained herein is correct, MBMG Group cannot be held responsible for any errors that may occur. The views of the contributors may not necessarily reflect the house view of MBMG Group. Views and opinions expressed herein may change with market conditions and should not be used in isolation. MBMG Group is an advisory firm that assists expatriates and locals within the South East Asia Region with services ranging from Investment Advisory, Personal Advisory, Tax Advisory, Corporate Advisory, Insurance Services, Accounting & Auditing Services, Legal Services, Estate Planning and Property Solutions. For more information: Tel: +66 2665 2536; e-mail: [email protected]; Linkedin: MBMG Group; Twitter: @MBMGIntl; Facebook:/MBMGGroup |


